

EOS has been declining from November 10 anrecently d reached its low of $2.23. The price is moving in a downtrend pattern, forming lower lows. For the past five weeks, the coin has been moving in the sideways channel between the price range of $2.76 and $2.02. The price got tested at the bottom support line on February 24 but failed to close below it, and the bulls tried to push the price up. EOS was moving below the downtrend line until February 03, after which the bullish candles were formed, but the price couldn’t cross the high of $2.76 and began to decline from there to its bottom support line.
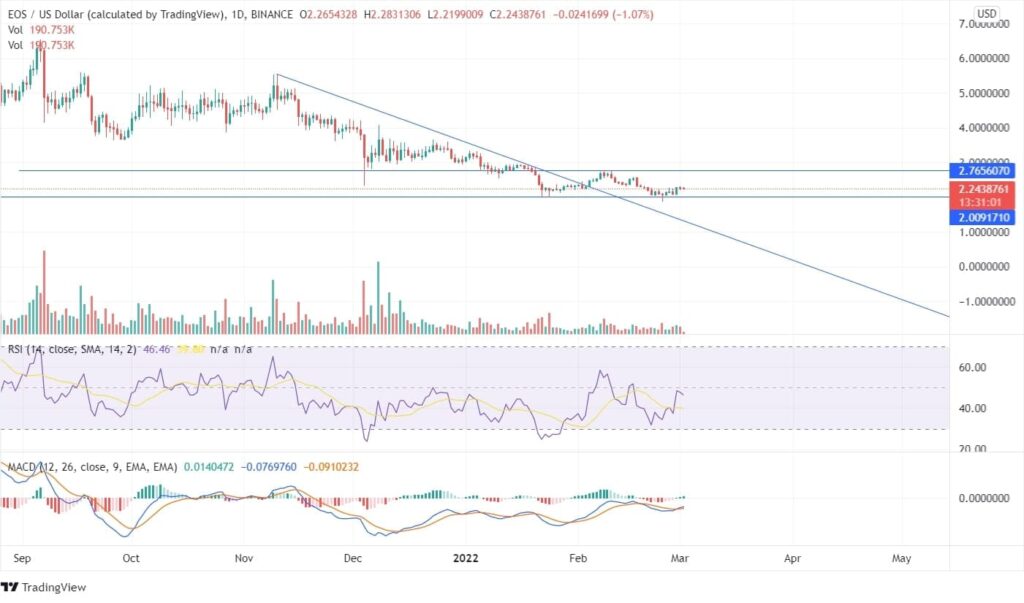
On the daily chart, the MACD line is above the Signal line indicates a bullish signal. On February 28, the coin showed a massive rise. Currently, the RSI indicator being 45 is neutral and may head towards the overbought zone in upcoming days. The volume bar shows remote movement towards bears or bulls, thus creating indecision regarding the price action. If the bulls continue to push the price, the coin may reach its top horizontal line of $2.76.
There is an existence of bullish divergence between the price and the RSI indicator, and once the price closes above the peak of the divergence that is $2.76, an up-trending market can be expected in the long run. Click here to get more details on the future projections of EOS. Traders should explore future forecasts before investing their hard-earned money.
If we look at the weekly time frame, the coin declined 22% in the previous week. The forming bullish candle shows that the EOS price has turned around from the support line and is heading towards its highs; however, the price needs to close above the swing high of $2.76 for the bulls to earn a long-term profit.
The technical indicators in the weekly chart have been in the bearish zone since November, and the coin has reduced 129%; however, in the previous week’s candle, the price got rejected at the lower support line indicating an upside move of price. If the upcoming candle closes below the swing low of $1.85, a down-trending pattern can be expected. The investors can enter the bullish trade for short-term gains; however, for long-term profits, they can wait for the coin to close above or below the swing high or swing low.